Catalogue element
bry-chart
Numbers as a bar, line, area or pie chart, in the kit's chart colours (never chosen by the app).
Settings
| Setting | Takes | Needed |
|---|---|---|
kind | bar, line, area, pie | yes |
label | text, at most 200 characters | yes |
categories | a list of at most 60: text, at most 200 characters | yes |
series | a list of at most 6: a record of name, values (needs name, values) | yes |
decimals | a whole number from 0 to 4 | no |
stacked | true or false | no |
loading | true or false | no |
empty | text, at most 200 characters | no |
Example
JSX
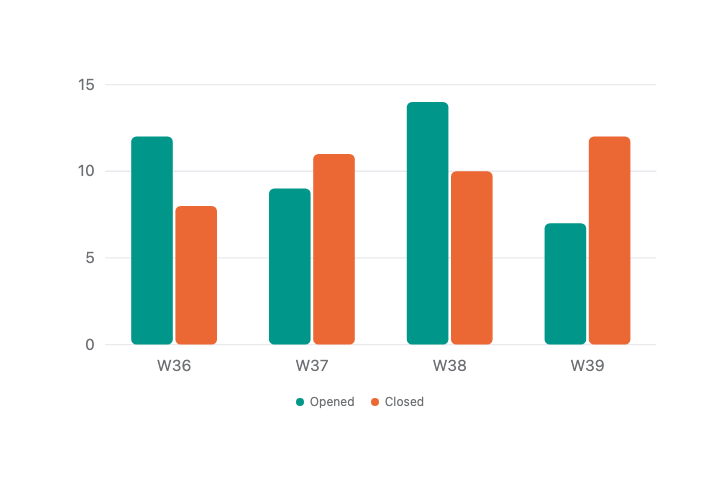
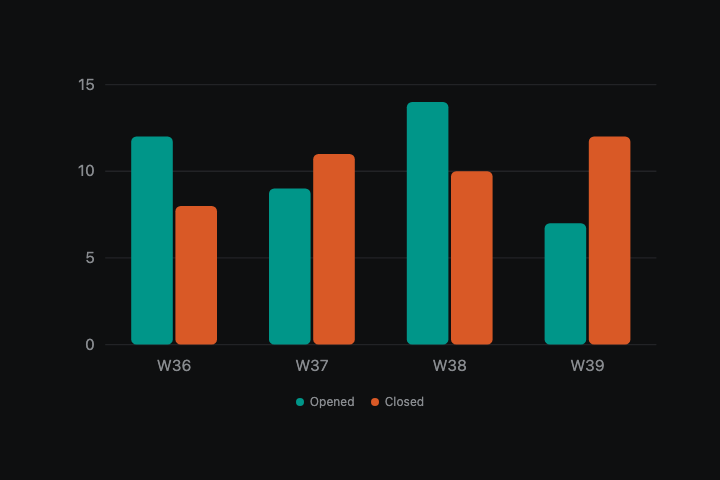
<bry-chart kind={"bar"} label={"Issues opened and closed by week"} categories={["W36","W37","W38","W39"]} series={[{"name":"Opened","values":[12,9,14,7]},{"name":"Closed","values":[8,11,10,12]}]} />Renderer contact sheet
These paths will hold the checked light and dark captures.